
You can compare results of evaluation of two different processes or process versions in a special comparison dialog.
First, open the process or process version diagrams you want to compare. Then, select one process diagram and press the Compare button in the Measures group in the Analysis tab.
The process is automatically evaluated and the following dialog appears (the set of measures that are shown depends on selected measures for the selected process, if Processing time or Variable cost was selected then there will be also a row added per each used role or custom item):
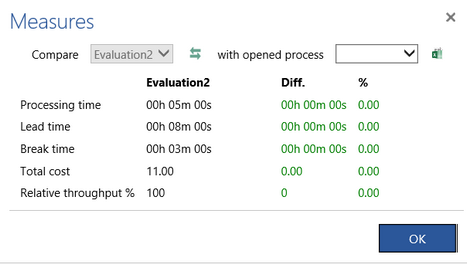
You can see the values of productivity indicators of the selected process. The name of selected process is shown in the Compare box as well as in the caption of the second column.
Choose the process you want to compare with in the with opened process box. The other process will be automatically evaluated and the results of comparison will be shown immediately:
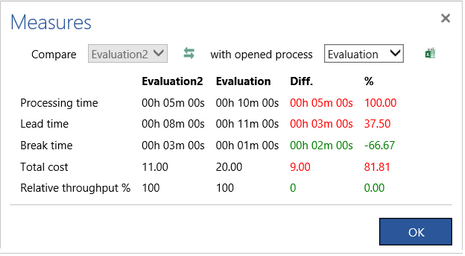
The third column shows the property values of the compared process. You can see its name in the caption of this column.
The absolute difference between the values of performance indicators of the compared and selected process is shown in the Diff. column. If the value for the compared process is bigger than the value for the selected process then the difference is positive and it is shown in red because the compared process is worse as far as this indicator is concerned. If the difference is negative it is shown in green because then the compared process is better (the opposite colors are applied for the reverse colored measure like e.g., Reliability where the smaller value means worse performance).
The last column % shows this difference in percentages in relation to the selected process. It means that the given performance indicator of the selected process was increased/decreased in the compared process by this factor. For example, if the Break time of the selected process is 3 minutes and of the compared process is 1 minute then it was decreased by 2, thus by 66%. If the processing time of the selected process is 5 minutes and of the compared process is 10 minutes then it was increased by 5, thus by 100%.
Press the button with two green arrows to swap the compared processes. Press the button with Microsoft Excel icon to export the comparison results to an Excel spreadsheet
Can I compare the the statistics of my processes?
When you create a process describing the current situation and another one describing the desired situation you might want to compare these two.
You can compare statistics of two different processes or their versions in a special comparison dialog.
First open the two processes or process versions you want to compare. Then, press the Compare button in the Statistics group in the Analysis tab.
The following dialog appears for comparison of statistics:
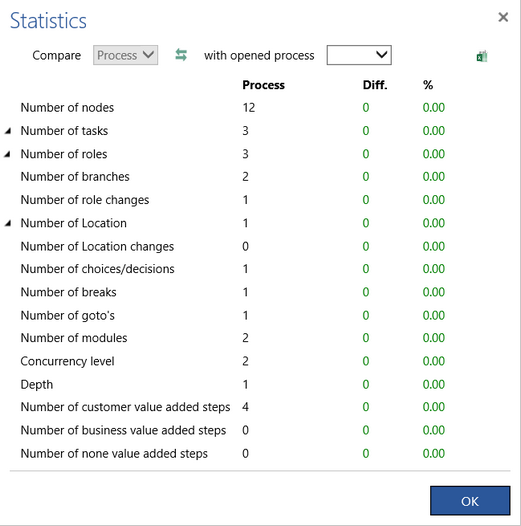
You can see the statistics of the selected process. The name of this process is shown in the Compare box as well as in the caption of the second column.
Choose the process you want to compare with in the with opened process box. The results of comparison will be shown immediately:
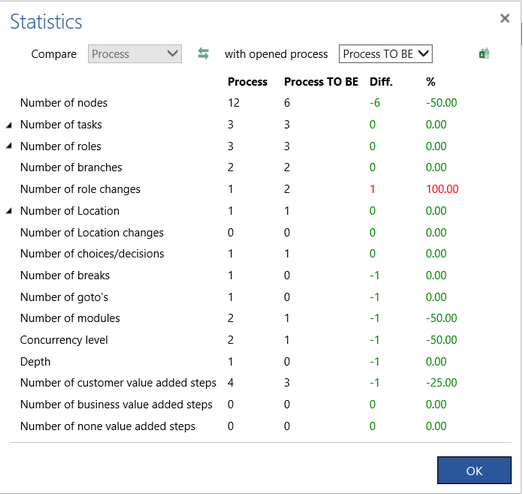
The third column shows the statistics of the compared process. You can see its name in the caption of this column.
The absolute difference between the values of the compared and selected processes is shown in the Diff. column. If the value for the compared process is bigger than the value for the selected process then the difference is positive and it is shown in red because the compared process is worse as far as this indicator is concerned. If the difference is negative it is shown in green because then the compared process is better.
The last column % shows this difference in percentages in relation to the selected process. It means that the given statistic of the selected process was increased/decreased in the compared process by this factor. For example, if the Number of nodes of the selected process is 12 and of the compared process is 6 then it was decreased by 6, thus by 50%. If the Number of role changes of the selected process is 1 and of the compared process is 2 then it was increased by 1, thus by 100%.
Press the button with two green arrows to swap the compared processes. Press the button with Microsoft Excel icon to export the comparison results to an Excel spreadsheet.