
Measures are process step properties used for process analysis. They describe both the input values for the evaluation and the calculated performance indicators. All are listed here.
All available measures are summarized in the table below. The I/O column specifies if this is an input measure for which an aggregated output measure is calculated (I/O) or if it is only a calculated output measure (O) or if it is only an input measures (I). If Break time or Lead time is an I/O measure then automatically the other one must be an output measure. You can decide which one is an input measure in the Measures settings.
The Steps column specifies the step types that are using the given measure.
Notice that there are two measures specified on the process level: Start date and Results multiplier.
By Activity we mean here Automatic, Manual, Computer, Internet, Telephone, Other, Decision, Meeting and Teamwork step types and all custom step types based on Task.
By Break we mean here the Break step type and all custom step types based on Break.
By Total we mean here the aggregated results for Start and Stop steps as well as results for the whole process.
All values here are averages calculated for one process case.
|
Property |
Description |
I/O |
Steps |
|---|---|---|---|
|
Break time |
Duration of a break or duration of a break prior to the execution of the activity. |
I/O (or O) |
Break, Activity, Total |
|
Buffer time |
Additional time spent on a case due to taking it over from another actor. |
I/O |
Activity, Total |
|
Cost to first visit |
The cost of a case accumulated prior to the first entrance to this step |
O |
All steps |
|
Customer value added time |
The amount of time spent on customer value added activities |
O |
Total |
|
End date |
Date and time of ending an activity or the whole process assuming that the start date is provided |
O |
Break, Activity, Total |
|
Fixed cost |
Fixed cost of execution independent of the actual processing time |
I/O |
Break, Activity, Total |
|
Fixed cost to first visit |
The fixed cost of a case accumulated prior to the first entrance to this step |
O |
All steps |
|
Number of performed tasks |
Number of tasks executed by a case. |
O |
Total |
|
Lead time |
Time that passes between the begin and the end of a case execution |
O (or I/O) |
Break, Activity, Total |
|
Process cycle efficiency % |
Value added time divided by lead time and multiplied by 100. |
O |
Total |
|
Processing to lead time ratio % |
Processing time divided by lead time and multiplied by 100. |
O |
Activity, Total |
|
Processing time |
The amount of work time necessary to perform an activity |
I/O |
Activity, Total |
|
Relative cost |
Cost of an activity multiplied by its relative throughput |
O |
Activity |
|
Relative processing time |
The amount of work time an activity was busy for a case |
O |
Activity |
|
Relative throughput % |
The percentage of the number of cases passing a step in relation to the total number of cases |
O |
All steps |
|
Reliability % |
The probability that the activity or the process will be executed correctly |
I/O |
Activity, Total |
|
Result multiplier |
The number used to multiply all total results |
I |
Process |
|
Start date |
Date and time of starting the process or the activity |
I/O |
Process, Activity |
|
Time between passes |
The time between moments when consecutive cases are exiting the step |
O |
All steps |
|
Time to first visit |
The time a case was processed prior to the first entrance to this step |
O |
All steps |
|
Total cost |
Variable cost plus fixed cost |
O |
Break, Activity |
|
Throughput (cases/min.) |
Number of cases exiting the process step in the interval of one minute |
O |
All steps |
|
Value added lead time |
Lead time while ignoring non value added activities and queuing time. |
O |
Total |
|
Variable cost |
The cost of an activity calculated as the amount of work necessary to perform it multiplied by the tariff (cost/hour) of the relevant role(s) |
O |
Activity, Total |
|
Velocity (task/min.) |
Number of tasks executed by a case in one minute time. |
O |
Total |
|
Work in progress (observed) |
Observed number of cases in execution |
I/O |
Break, Activity, Total |
Initially, only few measure properties are visible. These are Processing time, Break time (or Lead time), Total time, Relative throughput and Result multiplier. You can make the other visible using Select measures dialog. You can also set up the way the measures are presented (e.g., the time format) using Measures settings.
Selecting Measures:
You can decide what measures will be visible for a process. Open or select this process in Diagrams pane and press the Select button in the Measures group in Analysis tab.
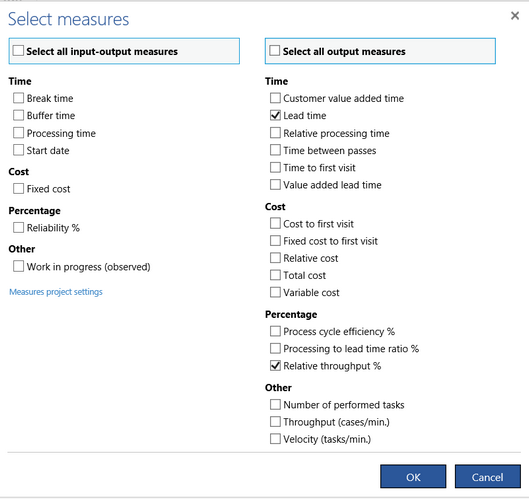
Check the measures you want to use and press OK. You will see these measures properties in the Properties pane in the Input measures and the Results categories. Some input measures will also appear in the Mini property editor.
Since the End date can only be determined when the Start date is provided, by selecting the Start date you actually select also the End date.
What is the 'show measures' tab for?
Showing/hiding measure balloons:
In order to show measure values on the process diagram press the Measures button in the Show / hide group of the Layout tab. An additional pane Show measures will be opened.
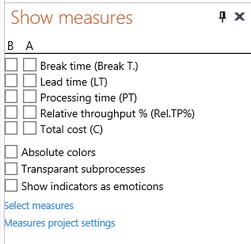
It will contain a list of the selected measures (if the list is empty click Select measures link to open the Select measures dialog). There are two columns of check boxes in front of the measure names: B (below) and A (above).
You can decide what measures are to be shown in balloons below a process step by clicking the corresponding check box in the B column of the Show Measures pane.
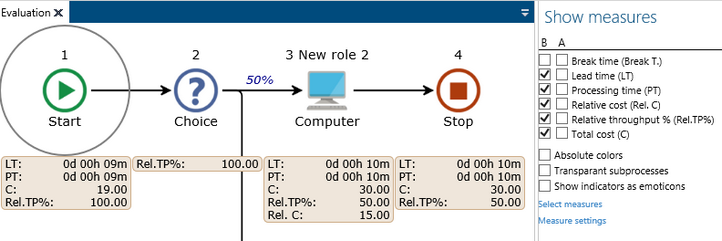
Note that because of the lack of space a short name for a measure (e.g. PT for processing time) is used in the balloon (this name is also shown in the parentheses in the Show Measures window). The process layout is expanded vertically in this case to create space for the balloons with the measures. Up to 7 measures can be shown in a balloon. If a measures is not defined for a certain process step it is not shown in the balloon. For example, Relative cost (RC) is shown only for a task.
Measure balloons are never shown together with the input/output or RASCI balloons. So, if you press the Measures button while the Input/Output or RASCI button is on the measures balloons will appear and the other balloons will disappear.
Measure values can also be presented above steps.