
You can influence the process diagram presentation in few ways. As for other types of diagrams, you can change the process diagram zoom factor and the default font properties.
The process steps and connections are decorated with additional texts and small icons to show graphically some of the process step properties. You can influence the process diagram presentation by deciding which of these properties will be shown or hidden for a particular process.
Moreover, you can decide on the initial process steps layout. If a modeler has left some subdiagrams expanded or collapsed you can overrule this by collapsing or expanding them yourself.
Can I change the SwimLane view of processes in the Publisher?
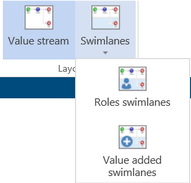
There are two types of a process layout: Value stream and Swimlane.
In the Value stream layout the steps are ordered from left to right in the order of the process flow.
In the Swimlane layout the steps are positioned in lanes depending of the value of the selected property. There are two standard properties used for swimlanes: Roles and Value Added. The custom properties can also be used as a basis for a Swimlane view. For example, if a modeler has used a custom type Locations when he created a process diagram then you will have an additional item called Locations swimlanes in the Swimlanes menu.
Thus, in general a process diagram can be in one of the following layouts: Value stream, Roles swimlanes, Value added swimlanes and additionally some custom type swimlanes, if available.
The initial layout of the process diagram is determined by a modeler. You can choose for another initial layout in the Engage Process Publisher. The viewer. however, can still change this layout in the Engage Process Viewer
You can decide on the initial process steps layout by pressing one of the buttons in the Layout group in the Layout tab.
A modeler can also adjust one of the automatic layouts by repositioning some of the steps and creating in this way a custom layout. Then, this custom layout will be initially shown and you cannot change it in the Engage Process Publisher (although it can still be changed in the Engage Process Viewer).
Can I Show/Hide diagram details?
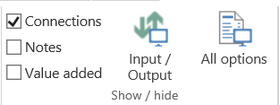
You can decide what details will be shown on the process diagram by checking on or off the boxes or by pressing buttons in the Show/hide group in Home tab. This, however, will be only the initial setting for the Engage Process Viewer. A viewer can still change the way a process diagram is presented although you can block this possibility for Notes and Annotations in the viewer settings.
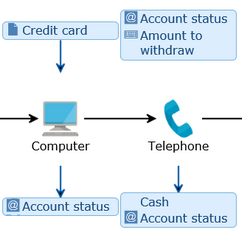
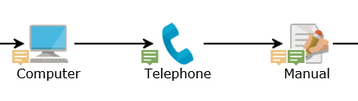
Press the Input/Output button to show input and output items for activities and subprocesses (service, phases). Click it again to hide these items.
Notice the the layout of the process may be expanded vertically to make place for the input (on top) and output (below) balloons.
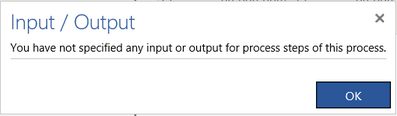
If there is no input/output document specified for any of the process steps the diagram does change and the following message appears to inform you:
Three most frequently used check boxes (Connections, Notes and Value added) are shown in the Show/hide group.
Click the All options button to open a dialog with all available check boxes.
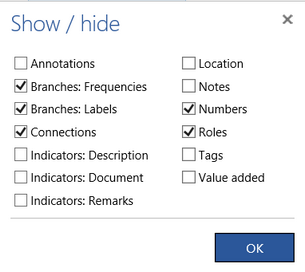
The following table explains the meaning of this check boxes:
|
Box name |
Description |
|---|---|
|
Roles |
Show names of the roles assigned to an activity or service above the activity/service icon. |
|
Notes |
Show the content of the Note property in a form of a yellow sticker on top of the step’s icon. |
|
Numbers |
Show the numbers of the process steps. Numbers of steps inside a subprocess are prefixed by the number of embedding subprocess from the higher level. If the Numbers box is checked then automatically theTags box is unchecked. |
|
Connections |
Show connections between Go to steps and their destinations (Go to join steps are always connected with their joins) |
|
Branches: Labels |
Show conditions or labels on the connections outgoing from a Choice, Decision and Parallel steps. |
|
Branches: Frequencies |
Show frequencies on the connections outgoing from a Choice and Decision steps. |
|
Indicators: Description |
Show a mark indicating that a description is provided for this process step. |
|
Indicators: Remarks |
Show a mark indicating that remarks are provided for this process step. |
|
Tags |
Show a process step tag in place of the step number. If the Tags box is checked then automatically the Numbers box is unchecked. |
|
Value added |
Show the Value added property of activities and breaks by changing the background of the process step: red for the non value added, yellow for business value added and green for the customer value added. |
|
Annotations |
Show annotations. |
If there are custom types defined for a selected process they will also appear on this list (Location in the example above). Custom type values will appear above the step icon.
Since the Tags and the Numbers appear in the same place on the diagram only one of them can be checked at a time. The same applies to the Roles and the custom types.
Description and remarks indicators:
Description is marked by ![]() and remarks are marked by
and remarks are marked by ![]() .
.
Presentation of value adding activities:
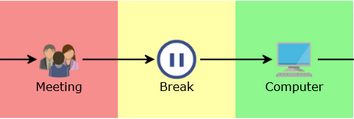
In this case, the Meeting step is non value adding, Break is business value adding and Computer is customer value adding .
Presentation of frequencies:
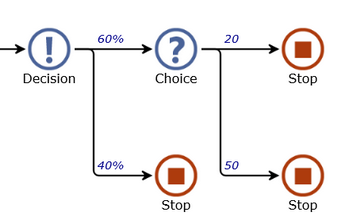
If all the frequencies of a choice sum to 100 then they are shown as percentages.