
You can decide what details will be shown on the process diagram by checking on or off the following boxes or by pressing buttons in the Show/hide group in Layout tab. You can show/hide data like input/output, measure balloons and RASCI roles
Press the Input/Output button to show input and output items.
Press the Measures button to show/hide measures (is not available in the Starter edition).
Press the RASCI button to show/hide RASCI roles.Notice that this button can have different name if you changed the responsibility settings for your project
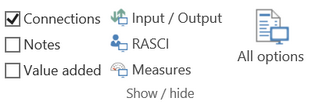
Three most frequently used check boxes (Connections, Notes and Value added) are shown in the Show/hide group.
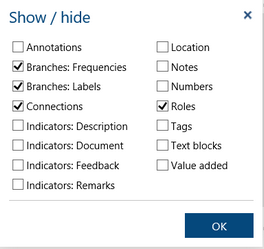
Click the All options button to open a dialog with all available check boxes.
|
Box name |
Description |
|---|---|
|
Roles |
Show names of the roles assigned to an activity or service above the activity/service icon. |
|
Notes |
Show the content of the Note property in a form of a yellow sticker on top of the step’s icon. |
|
Numbers |
Show the numbers of the process steps. Numbers of steps inside a subprocess are prefixed by the number of embedding subprocess from the higher level. If Numbers box is checked then automatically Tags box is unchecked. |
|
Connections |
Show connections between Go to steps and their destinations (Go to join steps are always connected with their joins) |
|
Branches: Labels |
Show conditions or labels on the connections outgoing from a Choice, Decision and Parallel steps. |
|
Branches: Frequencies |
Show frequencies on the connections outgoing from a Choice and Decision steps. |
|
Indicators: Description |
Show a mark indicating that a description is provided for this process step. |
|
Indicators: Document |
Show a mark indicating that there is a document attached to this process step; the number documents is also shown. |
|
Indicators: Feedback |
Show a mark indicating that there is a feedback referring to this process step; the number feedbacks is also shown. |
|
Indicators: Remarks |
Show a mark indicating that remarks are provided for this process step. |
|
Tags |
Show a process step tag in place of the step number. If Tags box is checked then automatically Numbers box is unchecked. |
|
Value added |
Show the Value added property of activities and breaks by changing the background of the process step: red for the non value added, yellow for business value added and green for the customer value added. |
|
Annotations |
Show annotations. This box is automatically checked whenever you start adding annotations |
|
Text blocks |
Show text block created in the Design mode |
If you has already defined your own custom type it will also appear on this list (Location in the example above).
Since Tags and Numbers appear in the same place in the diagram only one of them can be checked at a time. The same applies to Roles and custom types.
Description and remarks indicators:
Description is marked by ![]() and remarks are marked by
and remarks are marked by ![]() .
.
Presentation of value adding activities
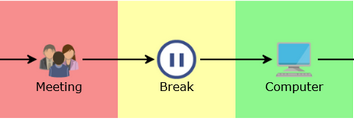
In this case, the Meeting step is non value adding, Break is business value adding and Computer is customer value adding .
Presentation of frequencies:
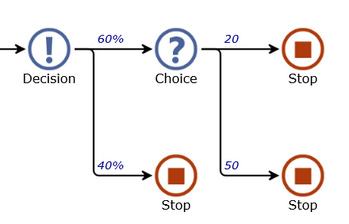
If all the frequencies of a choice sum to 100 then they are shown as percentages.
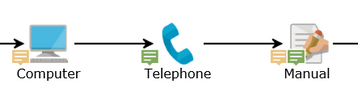
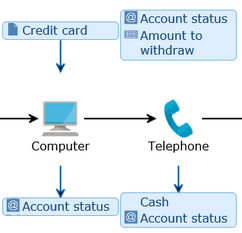
Showing Input/Output:
Press the Input/Output button in the Show/hide group in Layout tab to show input and output items for activities and subprocesses (service, phases). Click it again to hide these items.
Notice the the layout of the process is expanded vertically to make place for the input (on top) and output (below) balloons. (This is not the case anymore if you start arranging steps yourself)
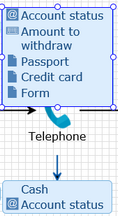
Up to 4 input and 4 output items will be shown on the diagram. If you want to see more defined items click Design tab and resize the Input or Output balloon.
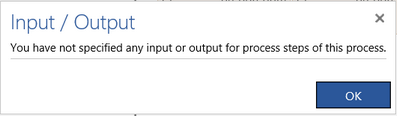
If there is no input/output document specified for any of the process steps the diagram does change and the following message appears to inform the user:
Input/output balloons are never shown together with the RASCI or measures balloons. So, if you press the Input/Output button while the RASCI or Measures button is on the input/output balloons will appear and the other balloons will disappear.
How can I show/hide RASCI roles?
In order to show RASCI roles on the process diagram press the RASCI button in the Show / hide group of the Layout tab.
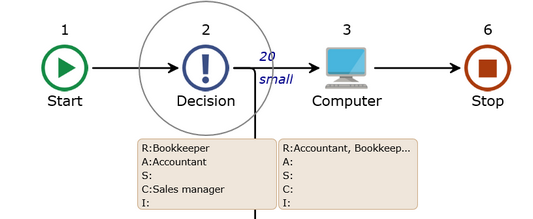
The process layout is expanded vertically to create space for the balloons with the roles.The first letter of the responsibility role is used as a label for the list of assigned roles. Notice that these letters can be different than the ones show above if you have change the responsibility setting for the project.
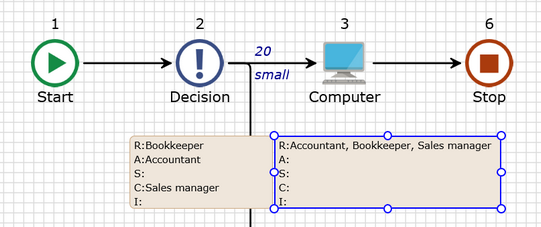
There is only one line per each responsibility role available. If content of a line does not fit to the balloon you can go to the design mode and stretch it.
RASCI balloons are never shown together with the input/output or measures balloons. So, if you press the RASCI button while the Input/Output or Measures button is on the RASCI balloons will appear and the other balloons will disappear.
Why are some indicators fixed on my process steps?
Some diagram details are added automatically by the tool and cannot be hidden.
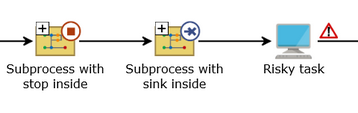
If a collapsed subprocess, service or phase has a stop inside then its icon is decorated by a small stop icon in the right top corner.
If a collapsed subprocess, service or phase has an uncoupled parallel branch inside then its icon is decorated by a small sink icon in the right top corner. If both stop and sink branch is inside then only small stop icon is shown.
If a Risk Point property of a process step is set then a small 'Danger' traffic sign is shown on the right.
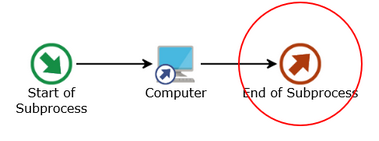
If a process step inside a subprocess is a destination of a Go to step from the higher level then the icon of this step is decorated by a small go to icon in the left bottom corner.